Crosstabs
This page is a part of PSPP Guide.
To compute crosstabs, go to Analyze – Descriptive statistics – Crosstabs.
First the row and column variables should be selected.
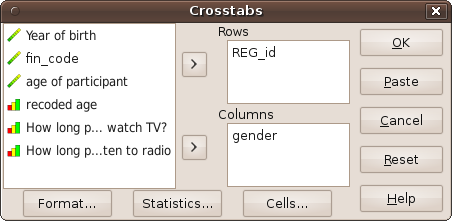
Crosstabs in PSPP.
By clicking on Statistics button you can select which statistics should be computed. It is also useful to select which cells should be computed (row percentage, column percentage, total percentage, count, residuals,…).
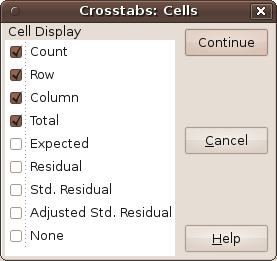
Setting crosstabs computations.
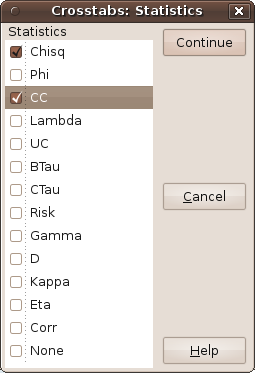
Crosstabs – statistics to be computed.
Results show the count distribution of males and females in Slovenian regions. Pearson Chi-Square and Contigency Coefficient show that there is no significant connections between gender and region of living (which is expected).

Results of crosstabs analysis.
Ključne besede: PSPP