ROC curve
This page is a part of PSPP Guide.
Receiver Operating Characteristic (ROC) curve is a graphical plot of the sensitivity, or true positives, vs. (1 − specificity), or false positives, for a binary classifier system as its discrimination threshold is varied. The ROC can also be represented equivalently by plotting the fraction of true positives (TPR = true positive rate) vs. the fraction of false positives (FPR = false positive rate). ROC curves can be used to compare the diagnostic performance of two or more laboratory or diagnostic tests.
The ROC command is used to plot the receiver operating characteristic curve of a dataset, and to estimate the area under the curve. This is useful for analysing the efficacy of a variable as a predictor of a state of nature.
To perform the test go to Analyze – ROC Curve.
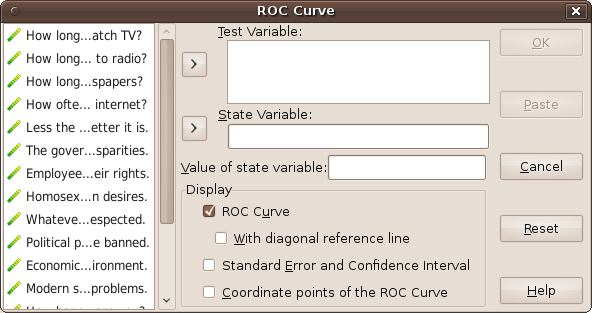
ROC curve computing.
Ključne besede: PSPP